
Navigating Your SGEN Dashboard
The SGEN Dashboard (dashboard.sgen.com) is your account-level control center — the place you go before you go into a specific site. From here you manage sites, track locations, organize clients, review billing, read cross-site analytics, and contact support. This guide orients you to every section: where it lives in the sidebar, what it shows, and when to reach for it.
Account console, not site editor
The Dashboard sits above any individual site. Content editing, pages, media, and forms live inside each site's own admin panel — accessed via Manage site in Site Manager.
Four sidebar groups
GENERAL for day-to-day operations · ANALYTICS for cross-site data · ACCOUNT for billing and administration · Support below them all. Every section is one sidebar click away.
Orientation first, flows later
This page covers layout and purpose. Step-by-step how-tos for adding a site, managing a subscription, and submitting a ticket are covered in their own dedicated guides.
What the SGEN Dashboard is
The SGEN Dashboard manages everything that sits above the level of a single site: your sites as a portfolio, your billing subscription, your client groupings, your Google Business locations, and your cross-site analytics. It is not the same as the per-site SG-Admin panel — those are separate, per-site tools reached from within the Dashboard via the Manage site action in Site Manager.
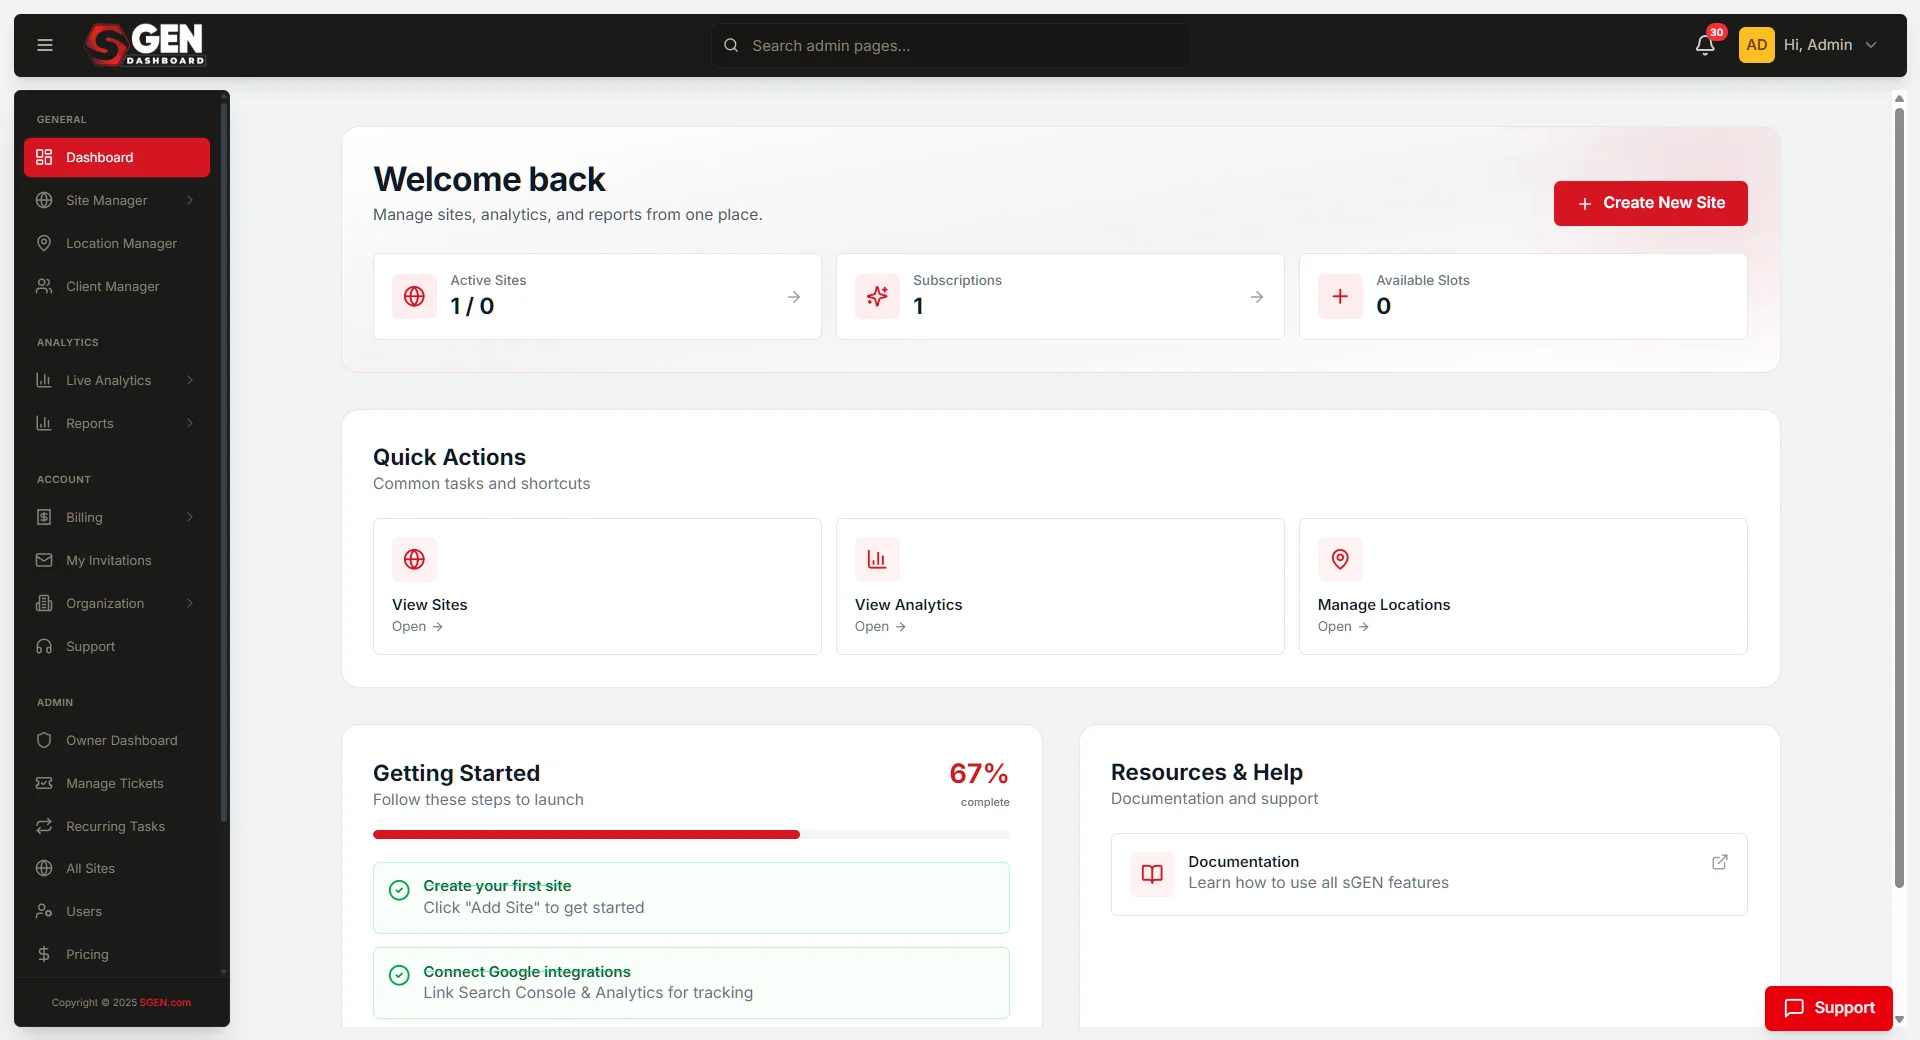
The left sidebar drives all navigation. It is divided into four groups: GENERAL, ANALYTICS, ACCOUNT, and a separate Support entry below them. Account Settings and a profile menu appear in the top-right corner.
The four sidebar groups
Every section in the SGEN Dashboard belongs to one of four groups. Understanding which group owns which section is the fastest way to navigate without exploring menus.
GENERAL
Day-to-day account operations
Dashboard — home view with stat cards and Getting Started checklist.
Site Manager — every site on your account as a card with usage stats and actions.
Location Manager — Google Business locations and manual locations.
Client Manager — sites grouped under client records for agency workflows.
ANALYTICS
Cross-site data
Live Analytics — Google Analytics portfolio view with date range, Compare mode, and per-site selector.
Reports — flagged SOON in the navigation. Not available in the current release. Use Live Analytics for current cross-site data.
ACCOUNT
Account administration
Billing — subscriptions, payment methods, invoices, and recent activity.
My Invitations — pending and expired org/site invitations.
Site Transfers — incoming and outgoing site transfers.
Organization — organization switcher (no plain URL anchor).
Support
Help and ticket management
Support — ticket summary counts (Open, Awaiting Reply, Resolved), Recent Tickets list, Submit a Ticket button, and View All link. Appears below the ACCOUNT group in the sidebar.
Orientation walkthrough
Six steps to orient yourself in the SGEN Dashboard. Each step names what you will see on screen. Complete this once and you will be able to navigate directly to any section without exploring menus.
1
Open the Dashboard home
Navigate to dashboard.sgen.com in your browser and log in. The home view (/dashboard) loads with the heading "Welcome back" and the subhead "Manage sites, analytics, and reports from one place." The left sidebar is visible immediately, with the GENERAL, ANALYTICS, and ACCOUNT groups stacked in order. If you land on a different page, click the Dashboard entry at the top of the GENERAL group to return to the home view.
2
Read the stat cards
The three stat cards at the top of the home view give you the account-level pulse. Active Sites — how many sites are active on your account. Subscriptions — how many active subscription plans are attached to your account. Available Slots — how many additional sites your current plan allows before requiring a new subscription. If a number looks wrong, go to Site Manager (GENERAL group) to verify the site list, or to Billing (ACCOUNT group) to verify subscription count. The Getting Started checklist below the stat cards tracks three onboarding steps and disappears once all three are complete.
3
Use the GENERAL group
The GENERAL group contains four sections: Dashboard, Site Manager, Location Manager, and Client Manager. Click any entry to navigate directly. Site Manager is the section you will use most — it shows every site on your account as a card with usage stats and action buttons.
4
Open Site Manager and read a site card
Click Site Manager in the GENERAL sidebar group. Your organization's sites appear as cards. Each card shows the site name, environment badges (SANDBOX, LIVE, STAGE), and a 30-day usage summary against your plan quota. The Manage site button opens that site's admin panel — the primary way to move from the account console into a specific site.
5
Find Billing
Click Billing in the ACCOUNT sidebar group. The page heading reads "Billing Overview". Four sections are visible: Subscriptions lists active plans with their tier and details. Payment Methods shows saved cards and billing address. Invoices shows billing history with dates, amounts, and download links. Recent Activity logs account-level billing events.
6
Reach Support
Click Support in the sidebar (below the ACCOUNT group). The page heading reads "Support" with the subhead "Get help with your account, billing, or technical issues." The top shows three summary stats: Open, Awaiting Reply, and Resolved ticket counts. The Submit a Ticket button starts the ticket submission flow. The View All link below Recent Tickets opens your full ticket history.
Section reference
Every sidebar section, its URL path, the group it belongs to, and what it contains. Use this as a quick lookup when you know what you need but not where it is.
Dashboard — GENERAL — /dashboard
Stat cards (Active Sites, Subscriptions, Available Slots), Quick Actions (View Sites · View Analytics · Manage Locations), Getting Started checklist, Resources & Help links.
Site Manager — GENERAL — /sites
Site cards with environment badges (SANDBOX, LIVE, STAGE), 30-day usage summary, Publish action, LIVE/STAGE tab shortcuts, and Manage site (opens the site's admin panel).
Location Manager — GENERAL — /locations
Connected Google accounts, manual locations, Add buttons for both location types.
Client Manager — GENERAL — /clients
Client records, associated sites, Tags, Add Client, Add Tag actions. Sites appear under client rows for agency and multi-client workflows.
Live Analytics — ANALYTICS — /analytics/ga-dashboard
Google Analytics portfolio view with date range selector, Compare mode, and per-site ACTIVE WEBSITE selector.
Reports — ANALYTICS — not available
Placeholder flagged SOON in the navigation. Not available in the current release. Use Live Analytics for current cross-site Google Analytics data.
Billing — ACCOUNT — /billing
Subscriptions, Payment Methods, Invoices, Recent Activity.
My Invitations — ACCOUNT — /account-settings/invitations
All / Pending / Expired tabs, org and site scope filter, search. Accept or decline invitations directly from this screen.
Site Transfers — ACCOUNT — /account-settings/site-transfers
Incoming transfers under Offered to you. Outgoing transfers under Sites you're transferring.
Organization — ACCOUNT — app-router switcher
Switches between organizations. No plain URL anchor. Switching changes the scope of everything you see — site cards, billing, clients, and locations all reflect the selected organization.
Support — below ACCOUNT — /support
Open / Awaiting Reply / Resolved ticket counts, Recent Tickets list (ID, title, status, priority, type, date), Submit a Ticket button, View All link.
Account Settings — top-right — /account-settings
Change Password, Danger Zone (Delete Account). Accessed via the profile menu in the top-right corner.
Troubleshooting
Common issues when navigating the SGEN Dashboard and how to resolve them.
Dashboard loads a login screen instead of the home view
Your session expired. Log in again with your SGEN credentials. Sessions are not shared across browsers or devices — log in on each.
Sidebar sections are missing
Your account role may restrict access. Organization owners see the full sidebar. Members with limited roles may not see Billing or Organization controls. Contact your organization owner to check your role assignment.
Stat cards show zeros but sites exist
You may be viewing the wrong organization. Click the Organization button in the sidebar and confirm which organization is selected. Switch to the correct one — the stat card figures update immediately.
Site Manager shows no site cards
Either no sites exist on the current organization, or you are viewing the wrong organization. Use the Organization switcher to confirm scope. If sites are still missing after switching, contact your account owner.
Reports shows nothing
Reports is marked SOON in the navigation — it is not yet available. Use Live Analytics for current cross-site Google Analytics data.
Live Analytics shows no data after selecting a site
Google Analytics may not be connected for that site. The Getting Started checklist on the Dashboard home includes Connect Google integrations as step 2. Complete that step for the site before expecting data in Live Analytics.
My Invitations shows "No invitations to show"
This is the correct empty state when no organizations have sent your account an invitation. Check the Pending tab to rule out a filtered view issue. If you expected an invitation, ask the sending organization to re-send it.
Account Settings or Billing are not accessible
Role-restricted accounts may not see these sections. Ask your organization owner to verify your permissions.
Examples
Three common scenarios that show how the sidebar groups work together in practice.
Monday morning account check. You log into dashboard.sgen.com and open the home view. The stat cards read: Active Sites 4, Subscriptions 2, Available Slots 6. One subscription covers a four-site agency plan; six slots remain. The Getting Started checklist shows 100% — all three onboarding steps are done. You click View Sites in Quick Actions, land in Site Manager, and review 30-day usage across all four site cards. The whole check takes under two minutes.
Tracing an unexpected billing charge. A team member asks why a charge appeared this month. You open Billing from the ACCOUNT group. The Invoices section shows a charge dated two weeks ago. The Subscriptions section shows the plan tier that generated the charge — a second subscription added for a new client project. You download the invoice from the Invoices list and forward it. The Recent Activity log confirms when the subscription was activated. No support ticket needed — both answers came from the Billing section alone.
Onboarding a new client's sites. You open Client Manager from the GENERAL group and add a new client record. You associate three existing sites under the new client. You open Site Manager and confirm all three sites appear under the By Client tab with the correct client label. You open Location Manager to check whether any Google Business locations need connecting for the new client. All three sections were accessed from the sidebar — no page reloads, no deep navigation required.
Heads up The Organization switcher changes the scope of everything in the Dashboard — site cards, billing, clients, and locations all reflect the currently selected organization. If any section appears empty or shows unexpected data, check the Organization selector first before investigating further.