
View per-product reports
⏱ 30-second answer below · full reference ≈ 12 min · skim the bold lead-ins to move faster.
In short. SGEN ships two per-product reports inside the Products section. Product Customers lists every customer who bought a specific product in a date range — order IDs, names, emails, status. Scan Product Orders flips the view: for a date range, it lists every product ranked by completed-order count. Open Product Customers from any product's edit page (sidebar → View product customers). Open Scan Product Orders via direct URL: /sg-admin/ecommerce/products/scan_orders (not in the left nav — bookmark it). Both reports populate automatically as your store takes real orders. That's the short version — read on for steps, worked examples, and troubleshooting.On this page: What each report does · Worked examples · Steps — Product Customers · Steps — Scan Product Orders · Troubleshooting
The Product Customers report lists every customer who bought a specific product within a date range — names, emails, order IDs, status. The Scan Product Orders report flips the view: for a date range, it lists every product with a count of completed orders and the order IDs.
Both reports populate as your store takes real orders; until orders exist, they render as empty-state screens with the filters and headers ready.
What is this for?
Per-product reports answer two very different questions:
- "Who bought this specific product?" — open Product Customers for that product. You get a list of orders: billing name, email, the customer who placed the order (linked to their account), the order status, and the date.
- "Which products sold the most in the last week?" — open Scan Product Orders. You get a list of products with completed-order counts; click a product name to jump into its edit page, or click an order ID to open the order.
Both reports are admin-only; customers never see them. They are operational tools for fulfillment, marketing, and inventory decisions.
You reach for them every time you need evidence of what sold versus what didn't, rather than just a gut sense.
The two summary lines at the top of each report give you the headline before you ever read individual rows. After a healthy month on your business' store — three SKUs moving steadily through April — the Scan Product Orders summary tiles read like this:
Total Units is the headline — every completed order line across every product in the range.
Products Sold tells you how many distinct SKUs contributed at least one completed order. On a small catalog, anything below your full SKU count is a flag worth chasing in Example 4 below.
Top SKU Units and Slowest SKU Units are the two bookends — the product carrying the headline and the product earning the smallest slice. They make at-a-glance health checks possible without scanning the full table.
Good use cases
Example 1: Identifying repeat buyers for a thank-you campaign. You want to send a hand-written note to everyone who bought the your product Single Origin in the last 90 days.
Open that product's edit page, click View product customers, set the date range to "last 90 days", click Select Dates. The table fills with orders — billing names and emails together. Copy the email list into your email tool or CRM.
For your business' Apr 14 — Apr 21 week, the your product Single Origin has 28 orders in the window. one repeat buyer alone accounts for 8 of them; the rest spread across five other repeat buyers. The Product Customers table reads like this:
The Quantity / Amount summary on the subtitle (28 / $812.00) reconciles with the row count and per-order totals — every reload re-runs the math from the live orders.
Example 2: Stock-taking after a busy week. You ran a weekend promotion and want to know which of your products moved most.
Open Scan Product Orders, set the date range to "the last 30 days", click Apply Filter. The table lists every product with its Completed-order count, sorted descending by Total. For your business' March 22 — April 21 window, the Scan Product Orders table reads like this:
your product Single Origin is the headline mover at 124 units, your detailed content piece is the steady digital seller at 47, and Canvas Tote Bag is the slow long-tail item at 18.
Reconcile those counts against your physical stock — a your product count higher than your inventory drop means you owe somebody coffee.
Example 3: Finding a specific order for a support call. A customer contacts you saying "I bought the your detailed content piece last week and never got my download link."
Open the your detailed content piece edit page, click View product customers, set the date range to "last 14 days", search by the customer's email. Their order row appears with the status (Pending / Processing / Completed / Refunded) and a link to the order view.
From there you check whether the order ever reached Completed; if it did and the customer still does not have their download, the issue is downstream of SGEN — likely the email delivery, not the store.
Example 4: Spotting a quiet product. You suspect the Coffee Sticker Pack is not selling.
Open Scan Product Orders, set the range to "last 30 days". If the Sticker Pack does not appear in the list — or has zero Completed orders — that is evidence. Decide whether to promote it harder, bundle it with the your product order flow, or retire it.
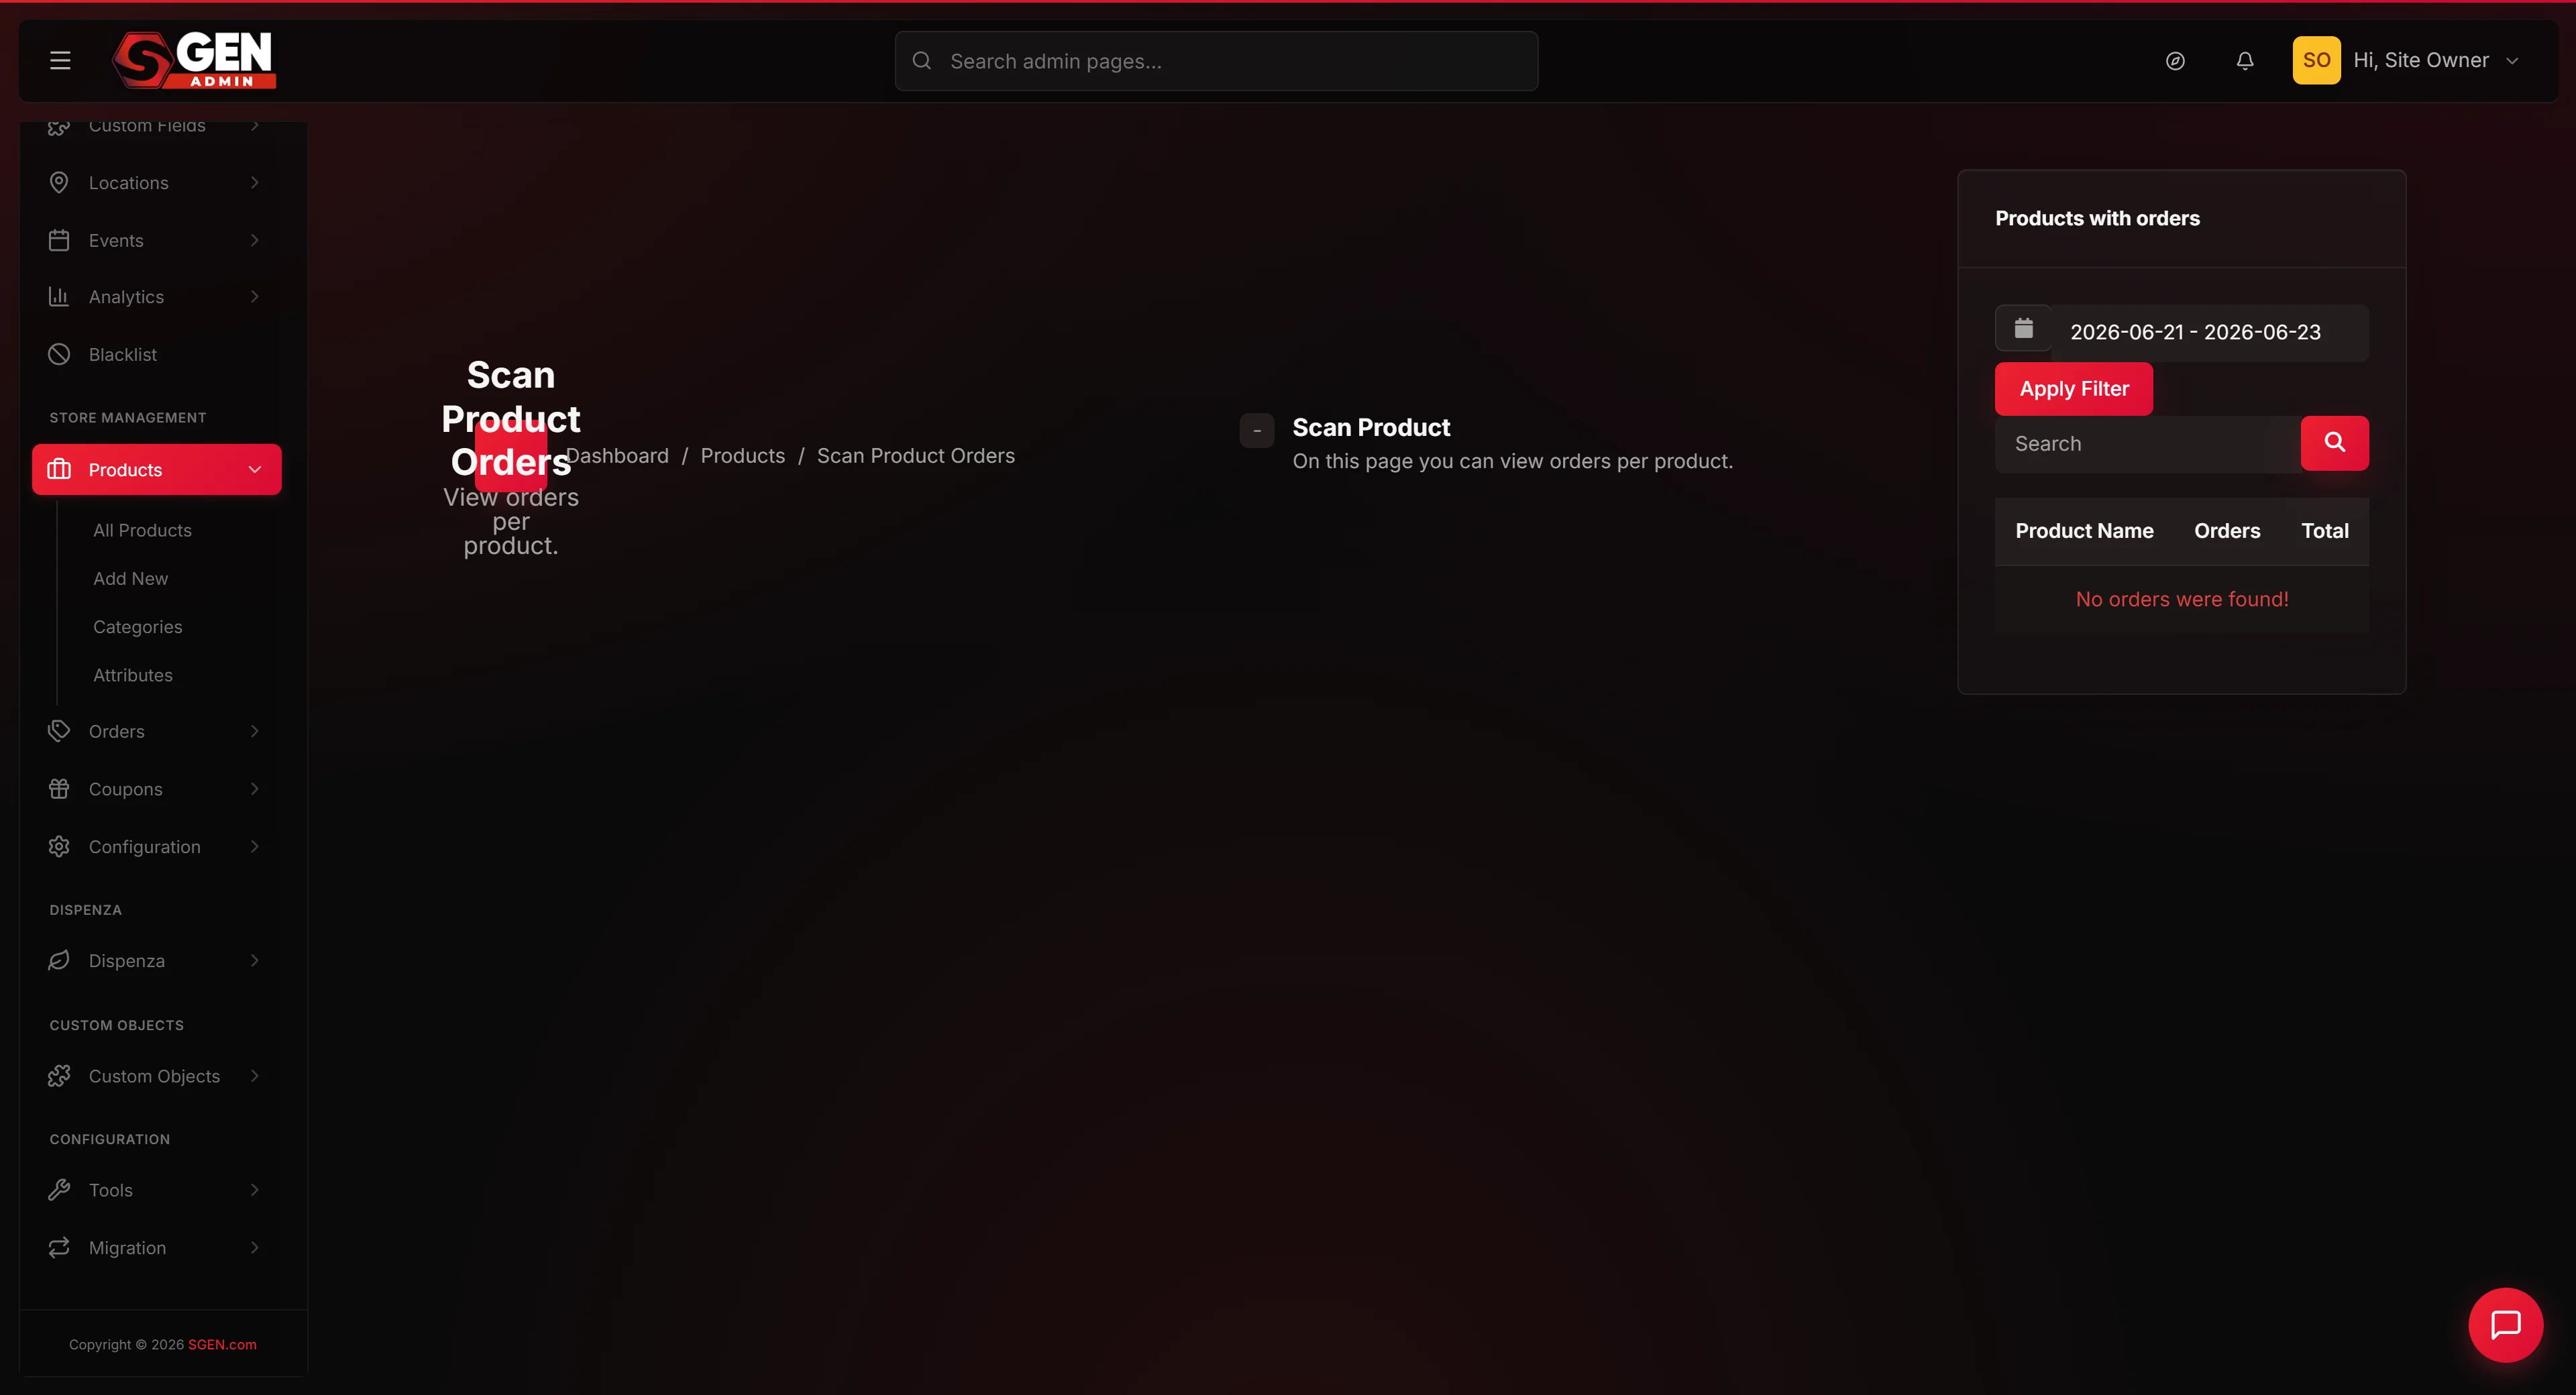
If the date range is tight enough — for example, picking a quiet weekday on a low-volume product — both reports will load with their headers and filters but no rows. The screen still tells you what you are looking at:
Example 5: Bookmark a campaign-window view. A spring promotion ran April 1 — April 21 against the your product Single Origin.
To rebuild that view in one click instead of three, the Product Customers URL bakes in the product id and date range. Copy the URL, drop it into Slack, and your teammate lands on the same Apr 1 — Apr 21 view you are looking at:
Pair the bookmark with the equivalent pre-campaign range — March 1 to March 31 — to compare lift on the same product across consecutive months.
Example 6: Spotting a top customer. Sometimes you want to know "who is my best buyer of your product?"
Sort the Product Customers list by Date, scan for repeat names, and the answer falls out. For your business' Apr 14 — Apr 21 week, the top repeat buyer purchased your product 8 times — the panel below pulls those eight orders together as one customer view, useful for thank-you notes or for handing the loyalty team a shortlist.
What NOT to use this for
- Do not treat either report as a revenue dashboard. These are per-product reports, not a whole-store income statement. For total revenue, order volumes, and ecommerce analytics, look at your ecommerce reporting (outside the Products section).
- Do not use Product Customers as a privacy-compliant export. If you need to hand customer data to a third party for a privacy or legal request, use your store's dedicated export tool. This screen is for operational lookup, not formal data handling.
- Do not expect per-variant breakdowns. Product Customers aggregates at the parent product level. If the Barista T-Shirt sold 10 in Medium / Black and 5 in Large / White, both show as Barista T-Shirt orders — the specific variant is visible on each individual order, not summarized here.
- Do not rely on Scan Product Orders for non-completed statuses. Scan Product Orders only counts orders with status Completed. Pending, Processing, and Cancelled orders are excluded. Use Ecommerce Orders for the full picture.
- Do not screenshot the report as a finance-grade record. The Quantity and Amount totals are accurate at the moment of the screenshot, but they shift the moment a teammate refunds an order, voids one, or your retention policy archives older data. Export the underlying orders to CSV when you need a frozen record.
- Do not read a missing product row in Scan Product Orders as "broken." A Published product with zero Completed orders in the range is excluded by design — Scan only lists products that contributed at least one Completed order. The product is fine; it has not sold in the window.
How this connects to other features
- Ecommerce → Orders — every order ID in the Product Customers table links to the Orders screen where you can see the full order, update status, refund, and message the customer.
- Products list — open any product from Products → All Products and its edit page shows a View product customers button that takes you straight to its Product Customers report. The Products list itself is documented in Manage every product in your store from one list.
- Ecommerce → Configuration — the currency symbol shown in the summary total (Amount: $0.00) comes from your store configuration. Change the currency under Configuration and both reports re-render their totals in the new symbol.
- Your user records — customer rows in the Product Customers table link to the user's profile under Users for the full lifetime order history across every product, not only this one.
- Ecommerce → Coupons / Discounts — when an order applied a coupon, the discounted amount is reflected in the Amount total on the Product Customers summary. The coupon itself is visible on each order's detail view.
- Categories and Attributes — when you ship variant-heavy products and want to read sales at the variant level, that is downstream of these reports. Categories are documented in Manage categories; the attribute system is documented in Manage attributes.
Before you start
- You are signed in to SGEN as an admin.
- You have at least one product to run Product Customers against. The product list is documented in Manage every product in your store from one list.
- For meaningful results: your store has taken at least one order. While orders are empty, both reports render with their filters and layout but no data to show. They fill up automatically as orders come in.
- Your store currency is set under Ecommerce → Configuration. Without it, the Amount total shows the system default which may not match your customer-facing pricing.
- You know which time-zone your store is configured for. Both reports interpret the date range in store time, so a "last 14 days" range starting at midnight in Manila will draw a different cut-off than the same range in New York.
Where to go — Product Customers
- Open the left navigation.
- Click Store Management → Products → All Products.
- Click any product's Edit row action.
- On the product edit page, scroll to the right sidebar. Click View product customers.
- You land on the Product Customers report for that product (the URL ends in
/customers/).
Where to go — Scan Product Orders
Scan Product Orders is not visible in the left navigation by default. Open it via direct URL:
- Open your admin with any product open in the editor (or any page that preserves your session).
- In the browser address bar, navigate to
/sg-admin/ecommerce/products/scan_orders. - The Scan Product Orders report loads.
Consider bookmarking that URL for monthly use — it is the single quickest way back to the table.
Steps — Product Customers
1. Confirm the product at the top
The report's H1 is Product Customers and the subtitle shows which product you are looking at. The breadcrumb ends with the product's title.
If you are on the wrong product, go back to Products and pick the right one.
2. Set the date range
The Date range picker at the top defaults to "last 14 days plus 1" (today's orders are included).
Click it to open the calendar. Pick a start and end date. Click Select Dates. The table refreshes.
3. Read the summary line
Just under the header, a summary line shows:
- Quantity — total units of this product sold in the range.
- Amount — total revenue for this product in the range.
These are aggregate numbers across every order shown in the table. For your product Single Origin's Apr 14 — Apr 21 week, those numbers read Quantity: 28 · Amount: $812.00 — they reconcile with the row count and per-order totals.
4. Search for a specific order
The Search box matches on order ID, billing name, billing email, and the customer's account email.
Type part of any of those and the table narrows.
5. Read each row
Each row is one order containing this product. Columns:
- Order — the order's admin ID, linked to the full order view.
- Billing Name — the name on the order.
- Billing Email — the email on the order.
- Customer — the customer's account (if they were signed in), linked to their user profile.
- Order Status — a colored badge: Pending / Processing / Completed / Cancelled / Refunded.
- Date — when the order was placed.
6. Open an order
Click the Order ID to open the full order view. From there you can see line items, shipping, payment status, and the customer history.
Steps — Scan Product Orders
1. Set the date range
The Date range picker at the top of Scan Product Orders defaults to "last 2 days".
Click it, pick a start and end date, click Apply Filter. The table refreshes.
2. Read the table
Each row is one product that had at least one Completed order in the range. Columns:
- Product Name — the product's title, linked to its edit page.
- Orders — comma-separated list of order IDs, each linked to that order's view.
- Total — the count of Completed orders in the range.
Rows are sorted by Total descending — highest-selling product at the top.
3. Search for a specific product
The Search box matches on product name, product ID, or order ID.
Use this when the date range is wide and the list is long.
4. Jump to a product or an order
Click a product name to open its edit page (useful when you notice an inventory problem and want to adjust stock).
Click an order ID to open that order.
Tips for getting more out of these reports
A few small habits make per-product reports more useful over time. None of these are SGEN-specific tricks — they are inventory craft any merchant builds on top of any store.
Bookmark the Scan Product Orders URL. It is not in the left navigation, which means every visit costs you a typed URL. A browser bookmark or a sidebar shortcut keeps it one click away — and the URL pattern in Example 5 above makes the bookmark portable across teammates.
Pick an explicit date range, not the rolling default. The Product Customers default of "last 14 days plus 1" drifts every day. When you compare this week to last week, an explicit 2026-04-14 - 2026-04-21 range stays comparable next month; a rolling default does not.
Reconcile Quantity against your inventory drop. If the your product Single Origin shows Quantity 124 in Scan Product Orders but your warehouse only logged 100 units shipped, the gap is somewhere — refunded orders, a packing-slip mismatch, or a partial shipment. Catch the gap weekly, not quarterly.
Pair Scan Product Orders with the Products list. When Scan shows zero orders for a product you expect to be moving, jump to Products → All Products and confirm the product is Published, the price is current, and the inventory is not at zero.
Keep a "top customer" shortlist. Once a quarter, sweep Product Customers across your top SKUs and write down the buyers that appear three or more times. That shortlist is the start of every loyalty campaign — eight your product orders from one buyer in a single week is exactly the signal you want.
Do not let the empty state scare you. A brand-new product, or a tight date range on a low-volume SKU, will show "No orders were found!" — that is the report telling the truth, not breaking. Widen the range before assuming anything is wrong. If the product still shows zero after widening, that is a data point: different placement, a different price, or different photography may be needed.
Compare like-for-like windows. Comparing "this week" to "this month" is unfair to whichever range is shorter. When checking lift from a launch, compare against the same number of days immediately before — seven days against seven days, thirty against thirty.
Reading the report for different roles
| Role | Start here | What you are checking |
|---|---|---|
| Marketing | Scan Product Orders, then Product Customers | Which products earned attention; who bought them. Pair for next campaign. |
| Fulfillment / ops | Scan Product Orders | Sort by Total, top-down — those are your stock-check priorities. |
| Customer support | Product Customers | Search by email, find the row, click the order ID — one click to the full order. |
| Solo site owner | Both reports, monthly | Top SKUs still moving, slowest SKU not quietly dying. |
What success looks like
- Product Customers loads for a product with at least one order showing the Quantity / Amount summary, one row per order, status badges, and clickable order IDs.
- Product Customers loads for a product with no orders showing an empty-state "No orders were found!" and a Quantity / Amount of 0 / $0.00 — the filters and search are still visible and ready.
- Scan Product Orders loads for a date range with Completed orders showing one row per product, sorted by order count descending, with clickable product names and order IDs.
- Scan Product Orders loads for a date range with no orders showing an empty-state "No orders were found!" and the date picker and search still visible.
- The Quantity number on Product Customers matches the row count when every row contains one unit; it is higher when an order line was placed with
quantity > 1. - The Total column in Scan Product Orders is the sum across every linked order — clicking through to those orders and summing them yourself reconciles to the same number.
- Clicking an order ID in either report opens the full order view in the same admin session — no re-login, no separate window.
What to do if it does not work
- Product Customers is empty even though I know there are orders for this product. The date range filter may be excluding them. Widen the range (try "last 12 months" to start). Also check that the orders have a status — if orders are still in Pending or Cart, they may not appear depending on your store's configuration.
- I cannot find Scan Product Orders in the menu. It is intentionally direct-URL only. Navigate to
/sg-admin/ecommerce/products/scan_ordersand bookmark it for future use. - Scan Product Orders shows fewer products than I expected. Scan Product Orders only counts Completed orders. A product that has only Pending orders shows zero here. For a wider view, look at Ecommerce Orders directly.
- The H1 and breadcrumb on the Scan Product Orders page look cramped or overlapping. That is a known cosmetic quirk of the page layout — it does not affect the data. Reload if the layout misbehaves.
- Opening a non-existent product's customer report shows a blank page. If you land on the Product Customers URL for an id that does not exist, the page renders without content. Go back to the Products list and pick a valid product.
- The product has orders but Amount shows $0.00. Confirm your store currency is set under Ecommerce → Configuration. The report uses that configuration to render the monetary totals.
- The Quantity number does not match my own count of the rows. Quantity sums the
quantityfield on each order line, not the row count. An order withquantity: 3adds three to Quantity but only one row to the table. - Two reports show different numbers for the same product. Product Customers counts every order regardless of status by default; Scan Product Orders counts only Completed orders. The gap is your Pending / Processing / Refunded volume.
Next step
- Manage every product in your store from one list
- Create a simple product
- Create a variable product
- Manage categories
- Manage attributes
Per-product reports
| Report | Question it answers | How to open |
|---|---|---|
| Product Customers | Who bought this specific product in a date range? | Product edit page sidebar > View product customers |
| Scan Product Orders | Which products sold the most in a date range? | Direct URL /sg-admin/ecommerce/products/scan_orders (not in left nav) |