
Reading your site vitals — what each metric means
⏱ Answer in 30 seconds below · full page ≈ 5 min · skim the bold lead-ins to move faster.
In short. Site vitals on your SGEN dashboard show four Google PageSpeed scores — Performance, Accessibility, Best Practices, and SEO. Each score is 0–100; green is 90+, amber is 50–89, red is below 50. The dashboard shows yesterday's automatic scan; trigger a fresh scan any time from the Actions panel. That's it — read on for what each number means and how to act on it.
On this page: What the widget measures · The four scores explained · Steps — first reading · Troubleshooting · Reference tables · Tips
How to read your site vitals on the dashboard
What is this for?
The site vitals widget is a daily health check for your live site — four numbers for desktop, four for mobile, all based on the same tool Google uses to evaluate pages. Green means healthy. Yellow means room to improve. Red means fix soon.
Scope
The site vitals widget measures your homepage by default, using Google's PageSpeed Insights test environment. It produces four scores for desktop and four scores for mobile — eight numbers total, each on a 0–100 scale.
| Score | What it measures | Most common cause of a drop |
|---|---|---|
| Performance | How fast your page loads and becomes interactive | Large images; render-blocking scripts; slow server |
| Accessibility | Whether all visitors — including those with disabilities — can use your site | Missing alt text; low colour contrast; unlabelled forms |
| Best Practices | Whether your site follows modern web standards | Broken images; no HTTPS; console errors |
| SEO | Whether search engines can index and understand your content | Missing meta descriptions; no viewport tag; thin content |
The widget does not measure: real visitor traffic or behaviour (use Analytics for that), security vulnerabilities, or pages other than your homepage. Scores are a lab measurement, not a real-user average.
Good use cases
- Daily health check. Glance at the dashboard first thing. Green across the board — move on. Yellow or red — you know where to dig in.
- After a content change. Added a hero video or swapped a banner? Run a fresh check to confirm performance didn't drop.
- Before a marketing push. Slow sites burn ad spend. Check that performance is green before driving paid traffic.
- Tracking progress over time. Numbers drifting down month-over-month signal something new is adding weight. The widget surfaces the trend before visitors complain.
What NOT to use this for
- Not a real-time monitor. The widget shows the last scheduled check. If your site goes down at noon, the widget won't reflect that — use uptime monitoring for live status.
- Not a security scanner. Vitals cover performance, accessibility, best practices, and SEO — not malware or vulnerable code. For security, talk to your hosting provider.
- Not a replacement for analytics. Vitals are a lab measurement. They don't tell you how many visitors converted, how long they stayed, or where they came from — use the analytics dashboard for that.
How this connects to other features
| Feature | Vitals impact |
|---|---|
| Media library | Large unoptimized images are the most common cause of low mobile performance. Check compression settings — recovering 20+ points is common. |
| Custom Codes | Each analytics tag, chat widget, or ad pixel adds page weight. Trim scripts you're not actively using. |
| Appearance / theme | Themes that load many fonts, animations, or video backgrounds score lower. Use the theme editor to trim what loads. |
| Pages | The widget measures your homepage by default. Heavy hero videos and feature blocks show up directly in the score. |
| Blog posts | Image-heavy post layouts are common performance offenders. If your blog landing page is yellow or red, check the post layouts first. |
Before you start
No setup needed — the widget is on your dashboard from day one. Three things to know before you interpret the numbers:
- First-time scans take a moment. New accounts show "Still gathering data" until the first scheduled check completes, usually within 5 minutes.
- Mobile scores are usually lower than desktop. Mobile devices have less computing power — a page that scores 95 on desktop might score 80 on mobile. That's normal; the goal is green (90+) on both.
- The numbers are a snapshot. Each check tests your homepage once. Use the widget as a directional indicator, not an absolute truth.
Where to go
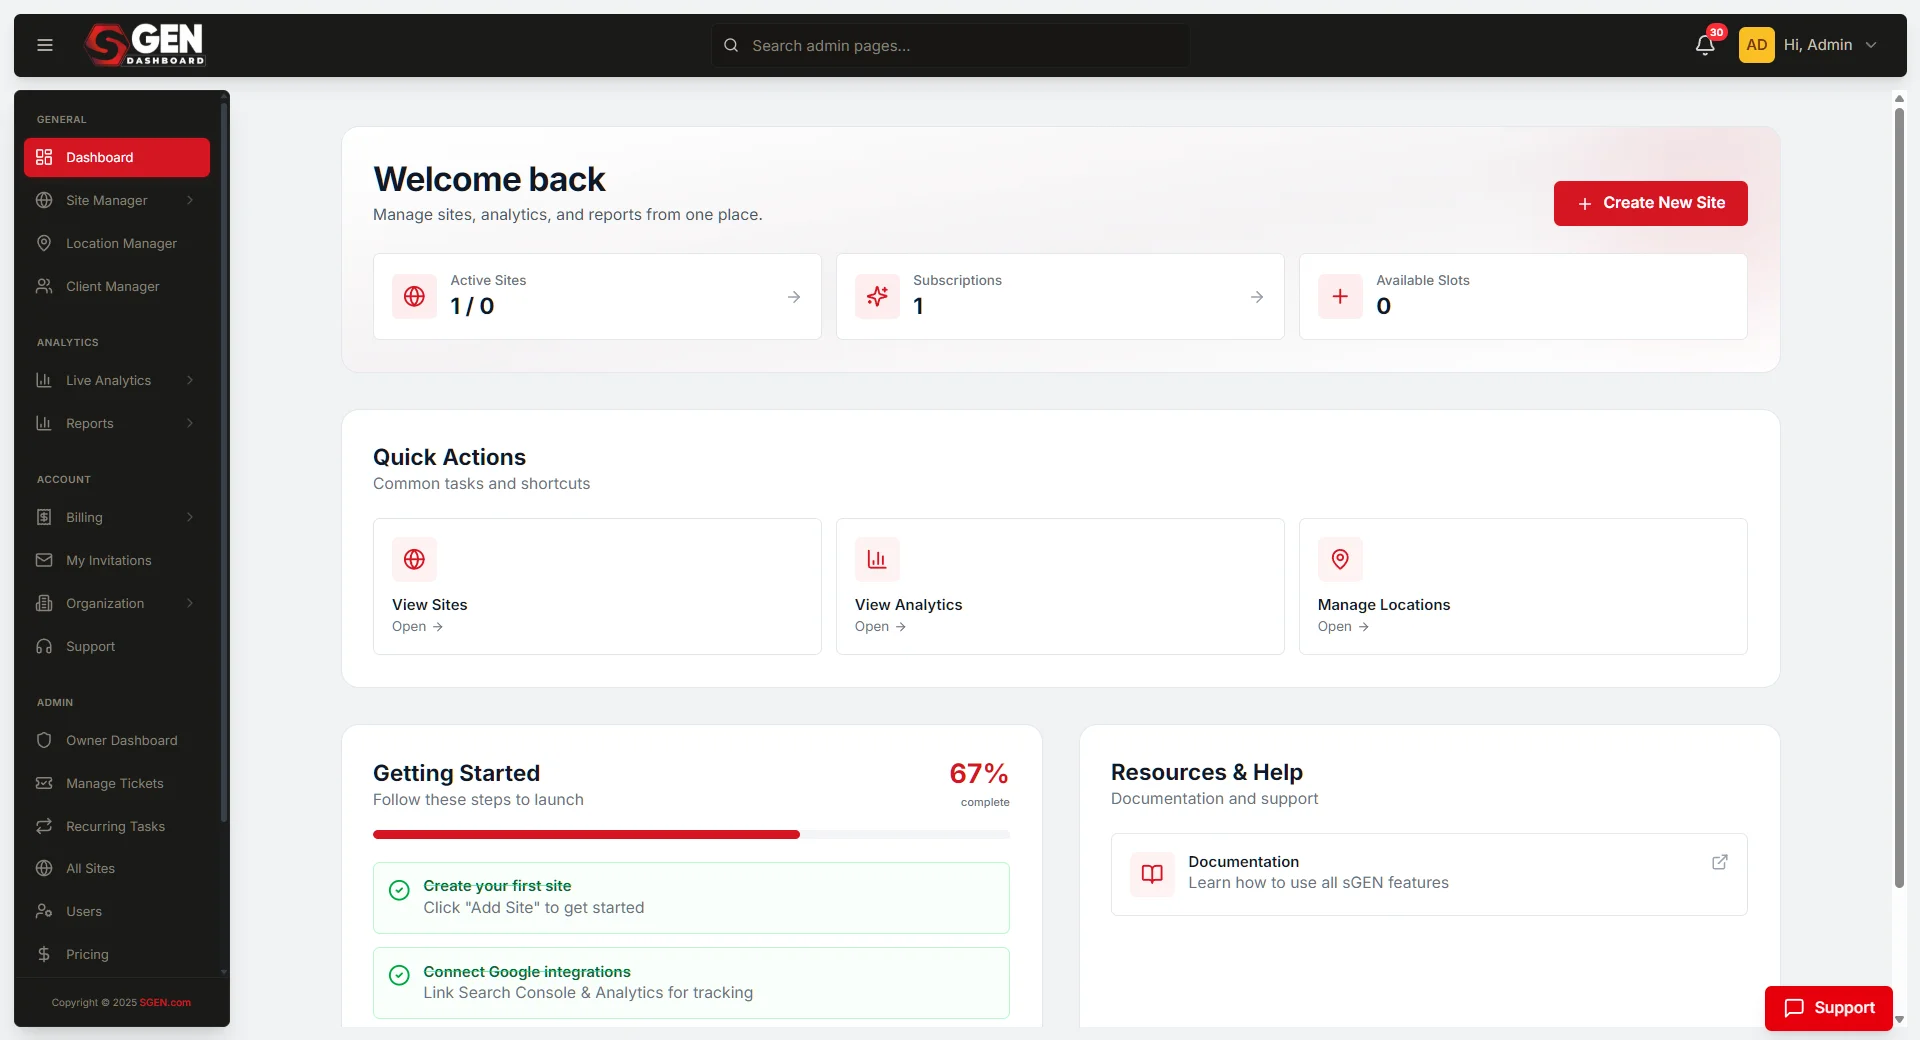
Dashboard. The site vitals widget appears on the main dashboard view — it's one of the cards on the right side, alongside other site-health snippets. You can't navigate "into" the widget the way you would with a settings page; it's a single read-out that you glance at and act on.
If you want a deeper view than the four headline numbers, click any one of the score chips and a detail panel opens with the breakdown for that category — what the number is made up of, and what's pulling it up or down.
Steps — getting your first reading and acting on it
1. Log in and look at the dashboard
When you sign in to your admin, you land on the dashboard. The site vitals widget is one of the cards visible without scrolling. If you've just created the account and have never run a check, the widget shows "Still gathering data" for a few minutes — this is normal. Come back in five minutes or click Run scan now to skip the wait.
2. Read the four numbers for desktop
The first row is your desktop score. Performance is how fast your site loads on a desktop browser. Accessibility is how usable your site is for visitors using assistive tools. Best Practices is whether your site follows modern web standards. SEO is how findable your site is in search engines. Each number ranges from 0 to 100 — higher is better.
Aim for green (90 or higher) on every category. Yellow (50 to 89) is a warning sign. Red (below 50) is something to fix soon.
3. Read the four numbers for mobile
The second row is your mobile score. Same four categories, same scale. Mobile numbers are often a few points lower than desktop because mobile devices are less powerful — that's normal and not a bug. The goal is the same: green is healthy, yellow is room to improve, red is fix-soon.
Most modern visitors come from mobile. If you have to choose where to focus, focus on the mobile numbers first.
4. Click into a low score for advice
If any number is yellow or red, click that score chip. A detail panel opens with the breakdown — for performance, this might be "your hero image is 2.3 MB and could be 200 KB." For accessibility, it might be "missing alt text on three images." Each item links to the place in the admin where you can fix it.
You don't have to fix everything at once. Pick the top one or two issues each week. The widget will reflect your fixes after the next scheduled check (or after you click Run scan now).
5. Run a fresh check after making a change
When you've made a change you think will help, run a fresh check to confirm. Click Run scan now. The widget shows a spinner for 30 to 90 seconds while the check runs in the background. When it completes, the new numbers appear and the "Last scanned" timestamp updates.
If a fresh scan does not improve the number, the change you made wasn't the right lever — try a different one. Don't keep grinding on the same fix if the score doesn't move.
What success looks like
A healthy site shows all four desktop scores at 90 or above (all green) and all four mobile scores at 85 or above. The "Last scanned" timestamp is recent — within the last day or two. You see no red numbers, and at most one or two categories sitting in yellow with a clear next-step you've parked for a quiet week.
You glance at the widget for two seconds at the start of your day, see green across the board, and move on to the actual work of running your business.
This is the page being measured — your homepage. The widget runs its check against this URL and reports back. Visually it doesn't change anything; it's just a measurement of how the page performs.
What to do if it does not work
The widget shows "Still gathering data" and won't change. Wait at least 10 minutes after a fresh signup or a fresh scan trigger. If after 10 minutes it still shows the same message, click Run scan now to retry. If that also fails, log out and log back in to refresh your session.
The numbers haven't updated since I made changes. A change to your site doesn't refresh the widget on its own — the widget shows the result of the most recent check. Click Run scan now after each meaningful change so the numbers reflect the current state.
Run scan now does nothing visible. Refresh the dashboard. If the click registered, you'll see a spinner appear. If nothing happens after a refresh either, your session may have expired — log out and log back in.
The scores look much worse than I expect. First, look at the "Last scanned" timestamp — is it recent? If it's from weeks ago, you're looking at a stale reading. Run a fresh check. Second, check whether you've added anything heavy recently — a video, a slider, a third-party widget. Heavy additions show up immediately in the next score.
Mobile is much lower than desktop. This is normal up to about 10-15 points of difference. If mobile is dramatically lower (say desktop 92, mobile 35), your site is likely loading desktop-only assets on mobile, which is a real problem to fix. Click into the mobile performance score for specific guidance.
One category is at zero. A zero score is rare and usually means the test failed entirely — perhaps your site was briefly down when the check ran, or a key page returned an error. Click Run scan now to retry. If a category persistently scores zero, contact support with your site URL and the timestamp of the failed check.
Reference
Score thresholds
| Range | Colour | Category meaning |
|---|---|---|
| 90–100 | Green | Excellent — no action needed |
| 50–89 | Yellow/Amber | Needs improvement |
| 0–49 | Red | Poor — fix soon |
Core Web Vitals targets (used in Performance score)
| Metric | Good | Needs improvement | Poor | What it measures |
|---|---|---|---|---|
| Largest Contentful Paint (LCP) | < 2.5s | 2.5–4.0s | > 4.0s | How soon the biggest element loads |
| Cumulative Layout Shift (CLS) | < 0.1 | 0.1–0.25 | > 0.25 | How much the page shifts as it loads |
| Total Blocking Time (TBT) | < 200ms | 200–600ms | > 600ms | How long interaction is blocked |
| Interaction to Next Paint (INP) | < 200ms | 200–500ms | > 500ms | How fast the page responds to input |
Refresh schedule
| Trigger | When it runs | What updates |
|---|---|---|
| Automatic | Daily at approximately 2 AM (site time zone) | Both Desktop and Mobile scores |
| Manual (Run scan now) | Any time you click the button | The strategy (Desktop or Mobile) you last selected |
| After site publish | Does not trigger automatically | Scores stay until next scheduled or manual scan |
Quick diagnostics — Mobile much lower than Desktop
| Desktop score | Mobile score | Difference | Likely cause |
|---|---|---|---|
| 92 | 80 | 12 points | Normal — mobile devices are less powerful |
| 92 | 35 | 57 points | Desktop-only assets loading on mobile — investigate |
Examples
Catching a regression. Your Store added a testimonial video to the homepage one evening. The next morning, mobile performance had dropped from 91 to 76. The site owner removed the autoplay attribute, ran a fresh check, and saw mobile climb back to 88. Five minutes total. Without the daily glance, the regression might not have surfaced for weeks.
Pre-launch check. Before spending $400 on ads, run a fresh vitals check on the landing page. If mobile performance comes back at 41 (red), click into the score — the top issue is usually an oversized hero image. Fix it, rerun, and confirm the score is in acceptable range before the campaign goes live.
Six-month trend. Monthly reviews catch slow drift. Performance that creeps from 78 to 92 over six months tracks with real organic traffic growth — the widget makes the connection visible.
Tips for keeping numbers green
- Compress images before uploading. Aim for under 200 KB for thumbnails; hero images under 500 KB. Enable the Media library's built-in compression — it's the single most common 30-point recovery.
- Trim third-party scripts. Analytics tags, ad pixels, and chat widgets all add page weight. Audit quarterly and remove anything you're not actively using.
- Use modern image formats. Enable WebP conversion in the Media library. It's free, automatic, and browsers have supported WebP for years — no reason to stick with heavier formats.
- Lazy-load below-the-fold content. The platform does this on most templates. Confirm you haven't disabled it on any custom block.
- Keep fonts light. One or two typefaces is fine; more than that is usually extra weight with no visible gain. Check what's loading in the theme editor.
- Check before you launch new pages. Run a fresh vitals check on any new landing page before driving traffic to it. A slow page burns ad spend; the widget is the cheapest pre-flight check available.
- Watch for accessibility regressions when copy changes. Alt text dropped, link text changed to "click here," or form labels removed — all reduce the accessibility score. Glance at the number after any copy update.
Frequently asked questions
Q: How often does the widget update?
A: A scheduled check runs daily at 2 AM (your site's time zone).
You can also trigger one manually with Run scan now.
The widget reflects the most recent successful check.
Q: Why are my numbers different from a tool I ran on my phone?
A: Different tools test under slightly different conditions.
The widget uses a controlled lab environment, which gives you consistent week-to-week numbers.
A phone-based test reflects your specific phone, network, and location.
Both are valid; compare the widget to itself over time, not to a phone test.
Q: Can I see the history of my scores?
A: Yes — click into any score chip and the detail panel shows a 30-day trend chart.
For longer history, contact your account manager.
Q: My competitor's site has a 99/99 score. How do I get there?
A: 90+ is the goal — anything above that is bragging rights.
The marginal gain from 92 to 99 is small in real-world terms; visitors won't notice.
Spend that effort on content and conversion instead.
Q: Does the widget cost extra?
A: No. It's part of the platform.
Q: Which page does the widget measure?
A: Your homepage by default.
If you want vitals for a specific other page (a high-traffic landing page, a checkout flow), contact support and we'll set up a per-page scan.
Q: Why did my number drop without me changing anything?
A: A few possible reasons.
A third-party script you depend on might have grown heavier.
The benchmark itself updates from time to time as web standards evolve, which can shift scores even on unchanged sites.
A scheduled platform update may have temporarily affected scoring.
If a number drops without a clear cause, run a fresh check. If the drop persists for a week, contact support.
Q: Are my numbers shared with anyone?
A: No. Your vitals scores are private to your admin account.
Reading the four categories more deeply
Performance — how fast your page becomes useful to a visitor. It tracks how soon content is visible, how soon a visitor can interact, and how stable the layout is during load. Low score drivers: large images, render-blocking scripts, slow server response, layout shift. Below 50 means visitors are likely bouncing before the page finishes loading.
Accessibility — whether visitors with disabilities can use your site. Checks alt text, colour contrast, labelled form fields, and keyboard navigation. A score below 50 means significant parts of your site are inaccessible. Accessibility is also an increasingly enforced legal requirement in many regions — a low score is a real business risk.
Best Practices — modern web hygiene. Covers HTTPS, no broken images, no console errors, proper image sizing, no deprecated browser features. Below 90 usually points to one or two specific things; click in for the details. Best Practices issues are typically the quickest wins.
SEO — how findable your site is by search engines. Checks meta descriptions, page titles, robots.txt, mobile-friendly viewport, and sufficient text content. A 100 means you have the basics in place. Full SEO requires content strategy beyond what this widget measures.
How frequently to check
- Stable site: the daily automatic check is enough. Glance each morning; only dig in if something went yellow or red.
- Actively changing: run a fresh check after each meaningful update — don't wait for the morning scan.
- Pre-launch: run a check the day before, after the day's content is locked.
- Long stable period with green numbers: once a week is reasonable.
What the numbers don't tell you
The widget is a technical hygiene check — it doesn't substitute for everything. It won't tell you whether your content is compelling, your offer is right, or your design converts. A 100/100 page with weak copy still won't sell. A 60/100 page with a great offer still might.
Use the widget for what it's built for: catching technical regressions early and giving you a consistent scorecard you can compare to itself over time. Use analytics for real visitor behaviour and conversion.
Next steps
- Scores dropped? See Resolving site vitals warnings for specific fix guidance.
- Image optimisation: Media library docs cover compression settings and WebP conversion.
- Script weight: Custom Codes docs advise which third-party scripts to keep and which to drop.
- Theme weight: Appearance docs cover font and animation settings that affect page weight.
- Real visitor behaviour: use the analytics dashboard alongside vitals for the full picture.