
How to read your lead-source breakdown
⏱ ~4 min read · quick answer above the fold · full reference below.
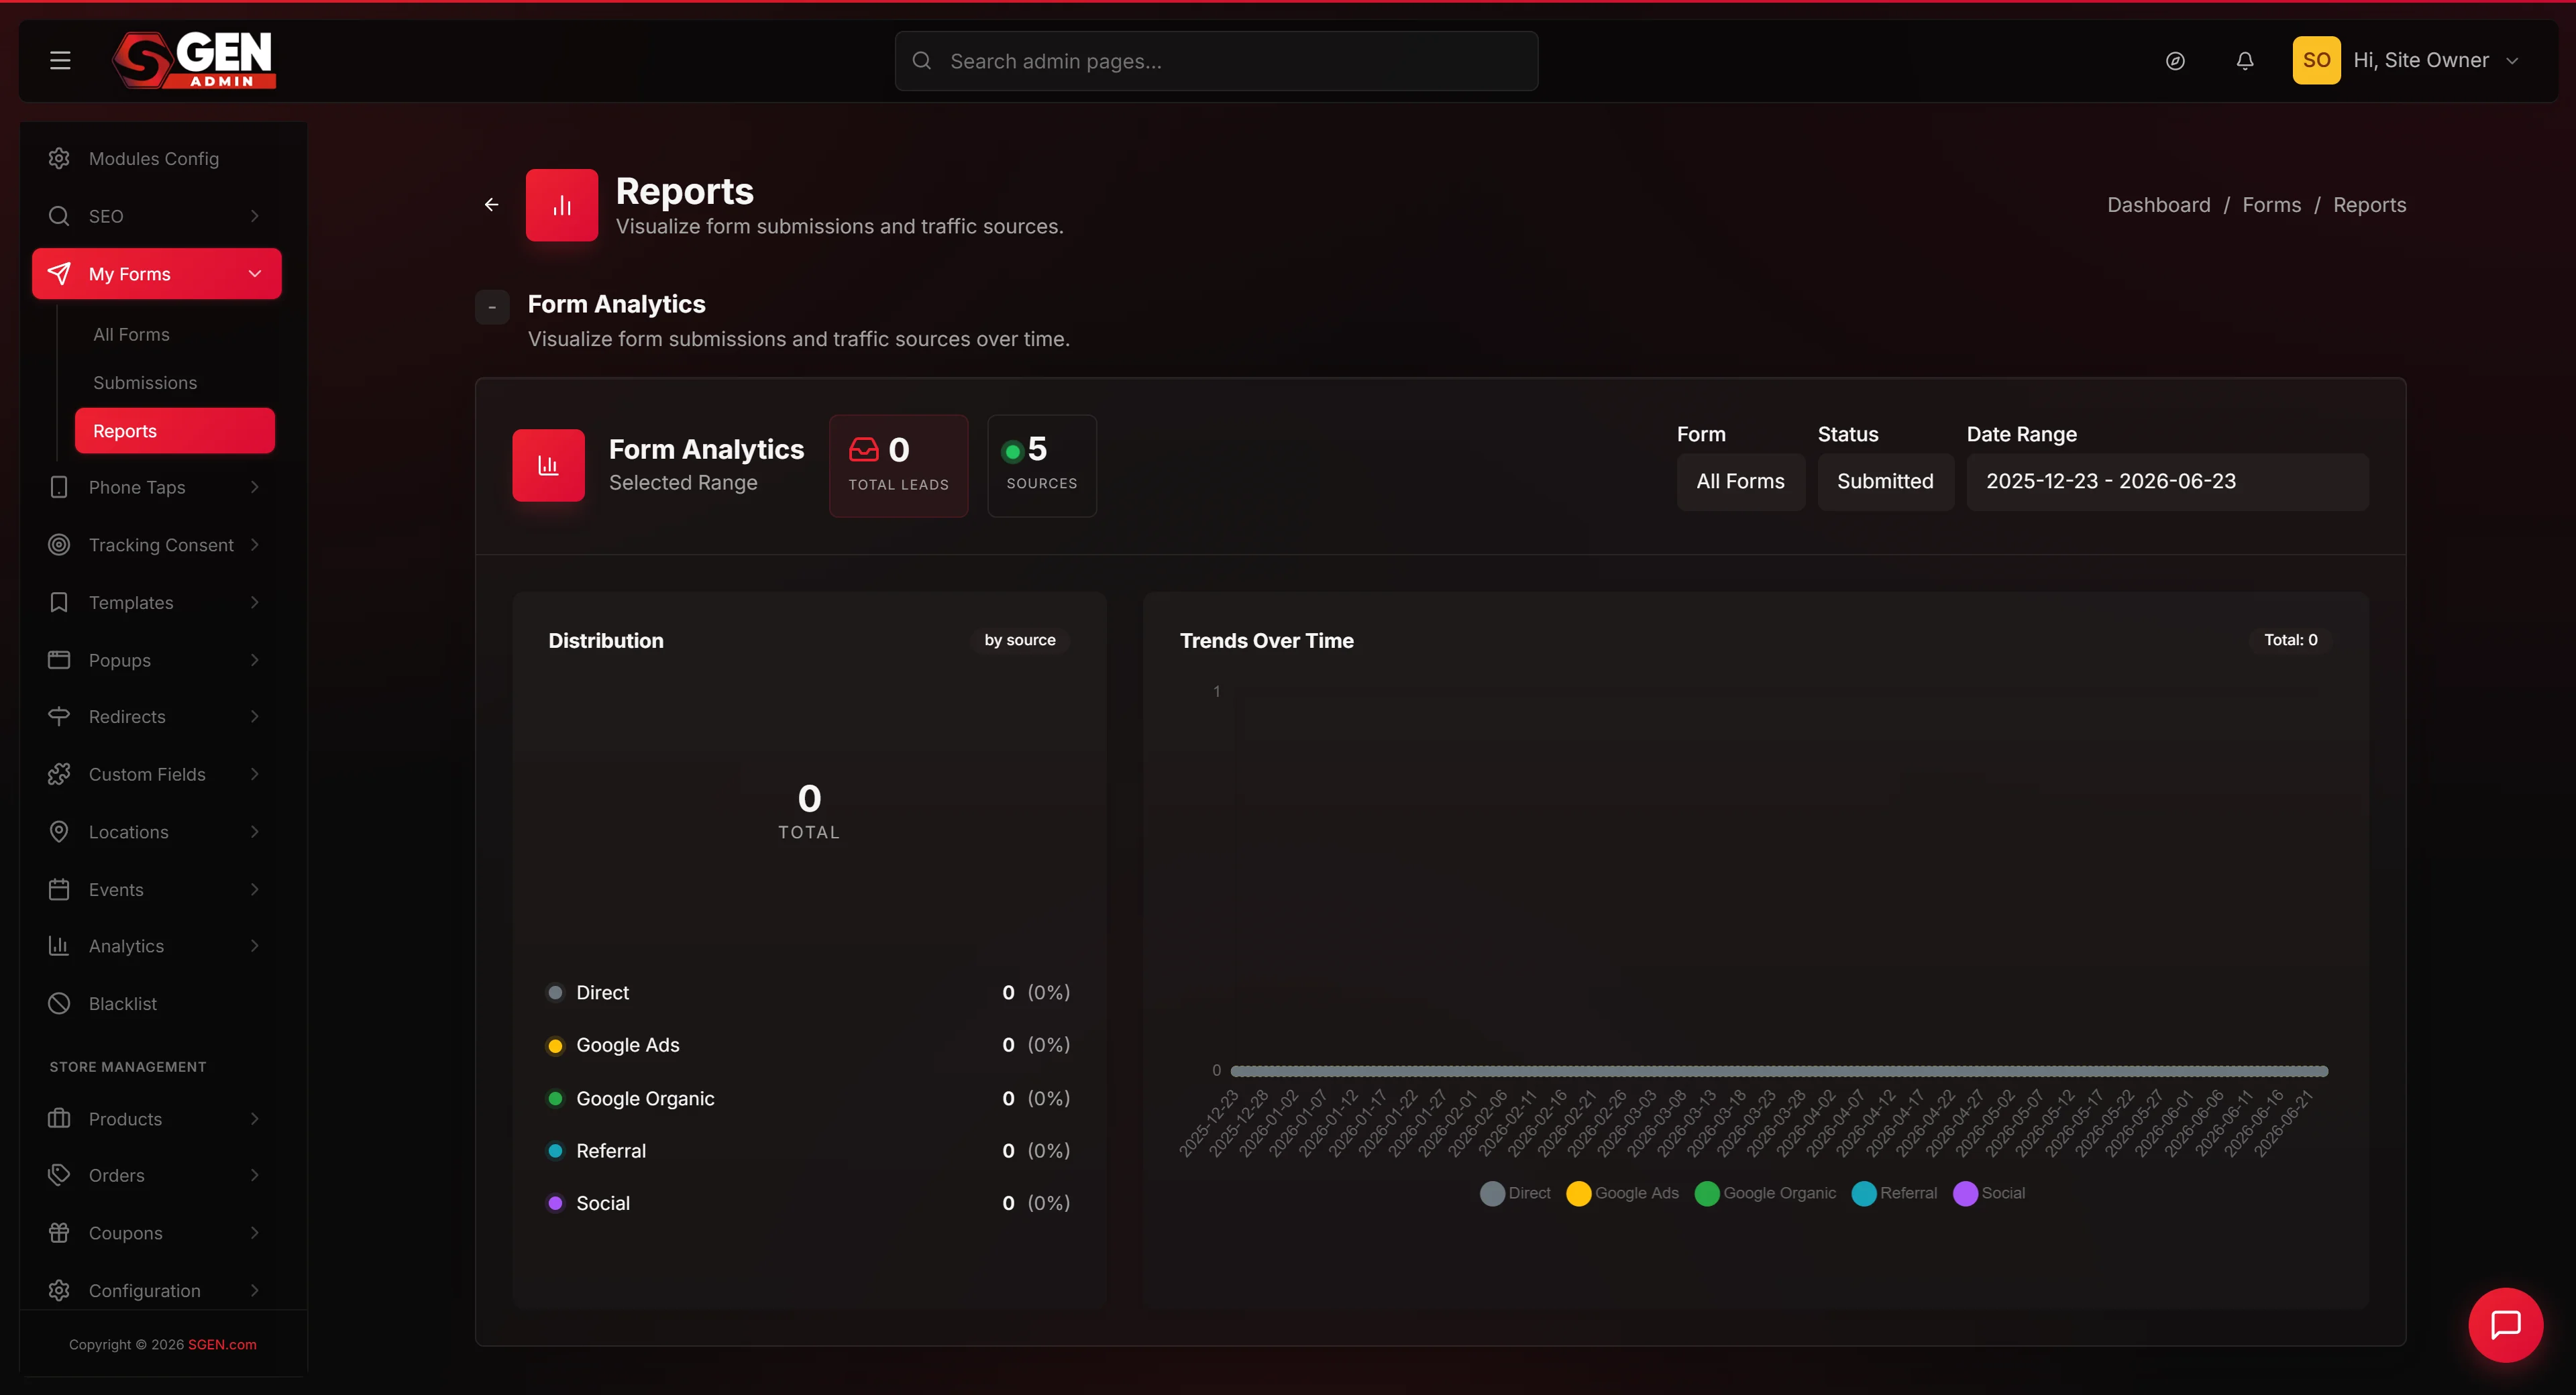
In short. Go to Forms → select a form → Reports tab → Lead-Source Breakdown. A doughnut chart shows which traffic channels (Google Ads, Google Organic, Referral, Social, Direct) drove form submissions for the selected date range. The number in the centre is the total submission count. Click any slice to filter the submissions table to that source. Everything here is read-only — changing the date range or clicking a slice does not affect your submission records.
On this page: What this chart is for · Where to go · Steps · Understanding source buckets · Examples · Troubleshooting
What is this for?
The Lead-Source Breakdown chart answers one question: where are your form leads coming from?
Every time someone submits a form on your site, SGEN records how that visitor arrived. It groups those arrivals into five buckets: Google Ads, Google Organic, Referral, Social, and Direct. The chart turns that raw data into a single at-a-glance picture of your lead mix.
Use it to:
- Confirm paid campaigns are attributing correctly — if you spent on Google Ads last week, the Google Ads slice should reflect it.
- Discover unexpected inbound links — a Referral spike you did not plan can reveal press coverage or a partner feature.
- Spot UTM tagging gaps before they distort reporting — a large Direct slice is often a sign that campaign links are untagged.
You can change the date range and the form selector at any time without affecting the underlying submission data.
Scope
One form at a time. The chart covers any published form on your site, filtered to the date range you select. It does not aggregate across multiple forms simultaneously. Source attribution is captured at submission time and does not change after that.
To compare attribution across two forms, open each form separately and note the proportions side by side. There is no combined view across forms on this screen.
When NOT to use this
- Do not use this as your only attribution tool for high-stakes budget decisions. The chart groups all Google Ads clicks into one bucket — it does not distinguish between two different Google Ads campaigns. For campaign-level granularity, add UTM parameters to your ad URLs.
- Do not treat the Direct bucket as genuine direct intent without investigating. Direct is a catch-all for any visit where SGEN could not read a referrer, including desktop email clicks and untagged campaign links.
- Do not rely on the chart if your form page is behind a login or paywall. SGEN cannot track the referrer in those contexts — all submissions will fall into Direct.
- Do not use this screen to read or respond to individual submissions. The chart is aggregate-only — open the Submissions tab for row-level detail.
Before you start
- Form must be published. A draft form shows zero submissions regardless of date range.
- Paid campaigns: your destination URLs must pass the
gclidparameter through to the final landing page. Without it, paid Google clicks appear in Direct, not Google Ads. - Email campaigns: tag your links with UTM parameters so clicks land in Referral rather than Direct.
Where to go
Forms → select a form → Reports tab → Lead-Source Breakdown section.
The section displays a doughnut chart with one slice per source bucket, a centre count, and a clickable filter row beneath. For a contact form with 100 submissions over 30 days:
Steps
1. Open your form
Go to Forms in your main navigation. Click the name of the form you want to review. The form detail page opens on the Overview tab by default.
2. Go to Reports
Click the Reports tab near the top of the form page. The Reports page loads with a default date range of the last 30 days.
3. Set the date range
Use the date-range selector at the top of the Reports page. Choose a preset (Last 7 days, Last 30 days, This month) or pick custom start and end dates that match your campaign period. The chart updates automatically when you change the range.
4. Read the doughnut chart
Each coloured slice maps to one traffic source bucket. Hover over a slice to see the exact submission count and percentage for that source. The number in the centre shows total submissions for the selected range. A slice that is unexpectedly large or small is your first signal to investigate further.
5. Click a slice to filter
Click any slice to filter the submissions table below to that source only. The table shows every submission that arrived from that channel. Click the slice again, or click Clear filter, to return to all submissions. Use this filter to review lead quality per channel before drawing conclusions.
6. Compare across date ranges
Set two consecutive periods with the custom date picker and compare proportions. A shift toward one bucket during a campaign window confirms that campaign's impact on form submissions.
Vocabulary
SGEN classifies every form submission into one of five source buckets at the moment the form is submitted.
Why Direct can be misleading
Direct masks paid traffic. Desktop email clients (Outlook, Apple Mail), messages in Slack or WhatsApp, and untagged SMS links all arrive without a referrer — landing in Direct even when they came from a campaign you sent.
If Direct is consistently 40% or more, add UTM parameters to your campaign links. After the next send, Referral should grow and Direct should shrink proportionally.
What success looks like
- After a paid campaign — Google Ads is the dominant slice.
- After a newsletter send — Referral grows, showing your email platform domain.
- After a social post — Social increases for one to three days.
If none of those buckets moves after a campaign, your landing-page URLs are likely missing the correct tracking parameters.
How this connects to other features
- Submissions Over Time (also in the Reports tab) tells you when submissions arrived; Lead-Source Breakdown tells you where those visitors came from. Use both together.
- The data feeds into the same records you can export from the Submissions tab.
- If you use form integrations (email notifications, CRM connections), the source bucket is visible inside SGEN only and is not currently passed to external destinations.
What to do if it does not work
The chart is empty but submissions exist in the Submissions tab. Check the date range. The chart respects the same date filter as the rest of the Reports page. Widen the range to include the period when submissions arrived.
Google Ads submissions are all landing in Direct. Confirm the gclid parameter survives your landing-page redirects. Click a live Google ad from an incognito browser and check whether gclid appears in the final URL before you submit the form. If gclid disappears during a redirect, update your redirect configuration to preserve query parameters.
The Referral bucket shows a domain you do not recognise. Click the Referral slice to filter the submissions table. Check the Referrer column in the submissions detail. Unrecognised referrers can come from content aggregators, social sharing previews, or scrapers.
The chart stops updating after several days. Refresh the Reports tab. The chart does not auto-refresh while the page is open — each page load pulls the latest data. If refreshing does not help, confirm the form itself is still published and receiving submissions.
A source bucket you expected is showing zero. Verify the form is embedded on the correct published page and that the date range covers the campaign period. If you recently changed your form's publish status or moved it to a different page, attribution may have reset for new submissions.
Social is always zero even though you post regularly. Social attribution requires visitors to click a link that carries a recognisable social-platform referrer. If your posts link to a link-shortener or a URL that redirects without passing the referrer, those clicks land in Direct instead.
The chart shows a large Direct slice you cannot explain. Review which campaigns ran during the period and check that each campaign URL uses UTM parameters. Tag your links, run the next campaign, and compare the chart again.
Frequently asked questions
Can I see which specific Google Ads campaign drove each submission? Not from this chart — all Google Ads clicks land in one bucket. Add UTM parameters to your ad destination URLs and the Referral bucket will show the UTM values in the referral detail column.
Can I export the lead-source data? The chart is not directly exportable. Export from the Submissions tab instead — the downloaded CSV includes a source column per row.
Does the chart update in real time? It reflects data as of the last page load. Refresh the Reports tab to pull in the latest submissions.
Can I lock the filter to one source bucket? Click a slice to filter the table. The filter holds until you click the slice again or click Clear filter — it does not persist across page refreshes.
Tips
- UTM discipline first. Consistent UTM parameters across all campaign links keep the chart readable and reduce the Direct bucket.
- After every newsletter send, check the Referral slice to confirm the referral domain matches your email platform.
- After a Google Ads campaign, verify the Google Ads slice grew during the campaign window — if it did not,
gclidis likely being stripped. - Team sharing tip: if you hand the Reports URL to a team member, remind them to set the date range — the chart defaults to the last 30 days.
Examples
Four common scenarios showing what the chart tells you and what to do next.
Example 1 — Campaign attribution after a Google Ads spend
Your marketing team ran a Google Ads campaign last month. Open the contact form, go to Reports, and set the date range to the campaign period.
Google Ads dominates every active campaign day. The April 13 peak (7 submissions) aligns with the day you increased your bid cap. Click the Google Ads slice to inspect individual submissions and confirm lead quality before reporting ROI.
Example 2 — Newsletter referral spike you did not plan for
A sudden Tuesday jump — no campaign running that week. Open the form, go to Reports, set the date range to that week.
Click the Referral slice and check the Referrer column — the spike traces to an industry newsletter that featured your site. Organic press coverage, not a campaign anomaly.
Example 3 — Direct-traffic investigation leading to a UTM fix
Direct is consistently 45% every month — unusually high for a site running regular email campaigns. Set the date range to last month.
Direct at 45% is the red flag. Click it — many submissions land on the same days as your email campaign sends, confirming the links were not tagged. Add UTM parameters and recheck after the next send.
Example 4 — Empty chart on a brand-new form
You published a new landing-page form yesterday. Zero submissions. The chart is empty.
Expected — not a problem. Confirm the form is published and the page it lives on is live. The chart populates automatically after the first submission arrives.
Related reading
- How to read your form reports — overview of all reporting panels in the Reports tab.
- Read form submissions over time — the Submissions Over Time line chart that sits alongside this one.
- Review form submissions — row-level detail for individual submission records.